As a manufacturer committed to consistently delivering on KPIs and ensuring your people, process and equipment are working in harmony, BEET Bot is your new best friend. A large language model powered by Google Gemini, BEET Bot provides powerful insights through natural language queries.
Interactive Insights
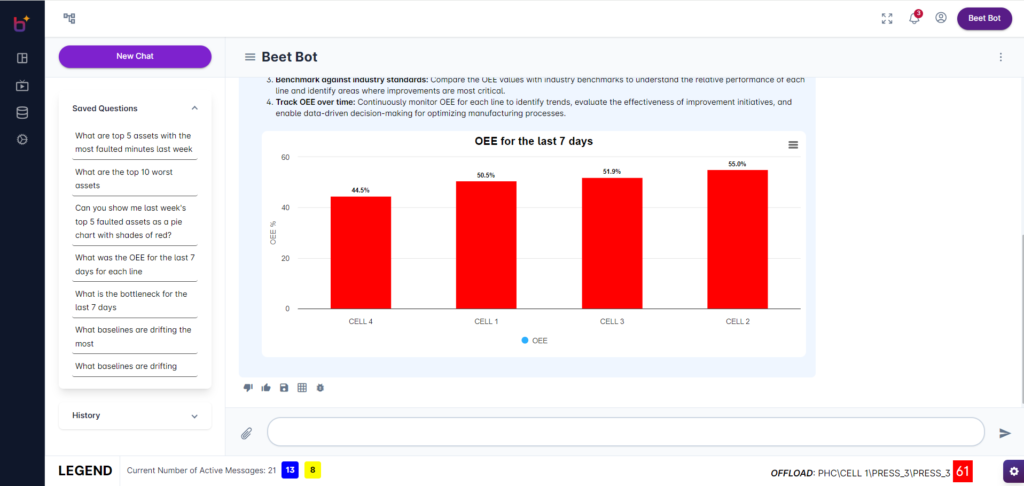
Natural Language Queries: Users can interact with the platform by asking questions in natural language. Example queries include:
“What was my OEE on the first shift for Line A?”
“What are my top servo faults this month?”
“How is my plant running this week?”
Instant Analysis: BEET Bot processes these queries, analyzes the relevant data, and returns descriptive insights paired with dynamically generated charts.
Instant Visualization
Charts and Graphs: The insights provided by BEET Bot are accompanied by visual representations of the data, such as bar charts and line graphs. This helps users to quickly understand complex information and make informed decisions.
Adaptive Learning
User-Driven Prioritization: As users continue to interact with BEET Bot and ask various questions, the platform learns which data points are most important. This continuous learning process allows BEET Bot to prioritize data for future consumption, improving the relevance and accuracy of its responses.
BEET Home Page
Your Gateway to Operational Excellence
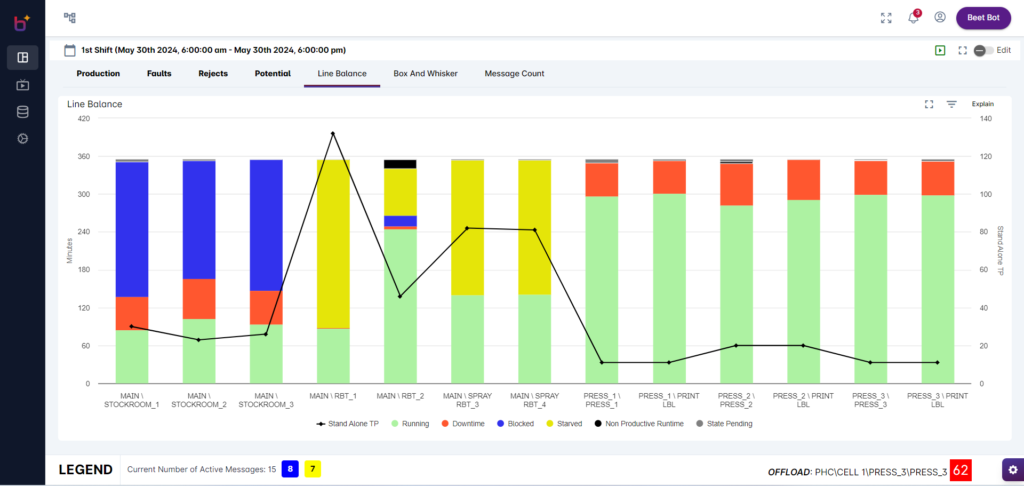
BEET’s highly customizable and interactive Home Page dashboard enables real-time monitoring and data visualization, providing a single pane of glass for your operations.
Customizable Tabs and Widgets
Tabs: Users can organize their Live View by creating and customizing tabs. Each tab can contain various widgets, allowing for a personalized report experience.
Widgets: These are customizable elements that display specific data points. Users can add new data to any tab by selecting from the widget gallery. The combination of tabs and widgets enables a tailored view of the most relevant information.
Real-Time Data Refresh
The data on the Live View is set to refresh every 60 seconds by default, ensuring that users always have access to the most current information. This feature is particularly useful for monitoring ongoing operations and making timely decisions.
Shift Selector
The shift selector allows users to generate reports for already completed shifts, providing flexibility in analyzing past performance data. Users can choose the desired shift and view detailed metrics accordingly.
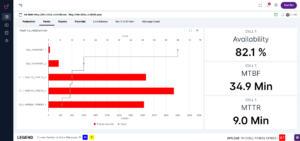
Key Metrics Display
The Live View prominently displays essential metrics such as Availability, Quality, Performance, Overall Equipment Effectiveness (OEE), Mean Time to Repair (MTTR), and Mean Time Between Failures (MTBF). These metrics provide a comprehensive overview of operational efficiency and quality.
Live Shift Data
At the bottom of the screen, users can see live shift data, including the current number of active messages and machine statuses. This section provides a snapshot of ongoing activities, helping users to stay informed about the current state of operations.
Global and Personal Tabs
Global Tabs: Created by admin users, these tabs are accessible to all users, ensuring that everyone has access to critical shared information.
Personal Tabs: Each user can create and save their own tabs, allowing for a fully customized report experience. Personal tabs cater to individual preferences and needs, providing a unique view for each user.
Home Page Editor
The Home Page Editor allows users to click the edit icon on any widget to modify its data or configuration. This feature makes it easy to update and maintain the Live View according to changing requirements.
A Real-World Example
A maintenance supervisor could set up an alert to trigger when a CNC machine experiences more than 5 minutes of downtime. Once this condition is met, the system will automatically send a notification to the relevant team members via their preferred communication method (text, email, or system notification), prompting them to take corrective action.
Conditional Alerts
Automate Notifications for Immediate Response to Critical Events
Use BEET’s Conditional Alerts feature to set up automated notifications based on specific criteria, enabling a proactive response to important events.
Setup and Customization
User-Defined Criteria: Users can define the conditions that trigger an alert. This includes selecting the asset to monitor, the measure to track (such as downtime or performance metrics), and the specific threshold values.
Notification Types
System Notifications: Alerts can be configured to appear as system notifications within the BEET Core interface.
Email and Text Messages: Users can also opt to receive alerts via email or text message, ensuring that they are notified even when they are not actively monitoring the system.
Real-World Application
Example Scenario: A maintenance supervisor could set up an alert to trigger when a CNC machine experiences more than 5 minutes of downtime. Once this condition is met, the system will automatically send a notification to the relevant team members via their preferred communication method (text, email, or system notification), prompting them to take corrective action.
Real-Time Monitoring
Live Updates: The conditional alerts are monitored and updated in real-time, providing immediate feedback when defined conditions are met. This helps in maintaining continuous oversight and quick response to potential issues.
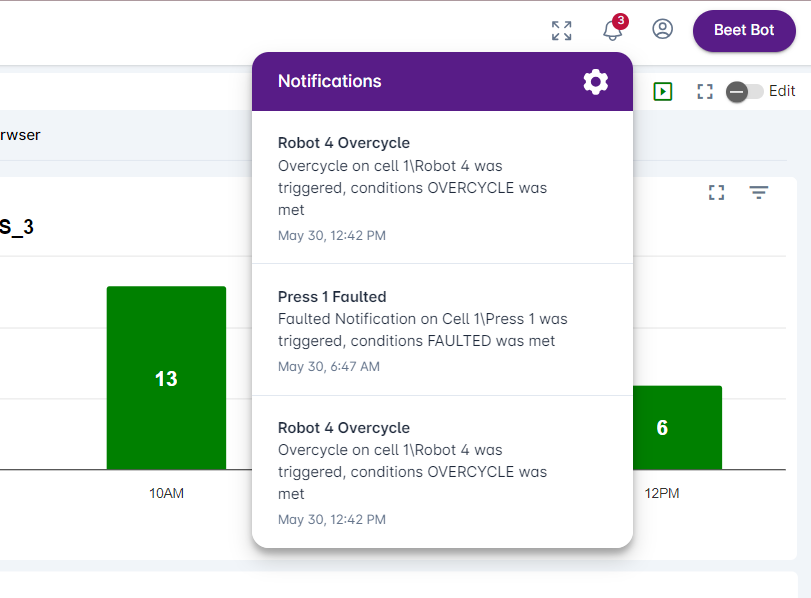
Notifications Panel
Consolidated Alerts: All active and historical alerts can be viewed in a dedicated notifications panel within the BEET Core 5.0 interface. This panel provides a comprehensive overview of all conditions that have been met and the corresponding actions that need to be taken.
Ready to transform your operations? Get in touch to discover how BEET Core 5.0 can optimize your workflow, enhance performance and increase throughput.